Model Metrics
Evaluatation
Note
Model evaluation is performed on the Validation split of the dataset. Validation data is not used in model training. Here, 20% of the training images from each class were randomly assigned for validation.
F1 Score
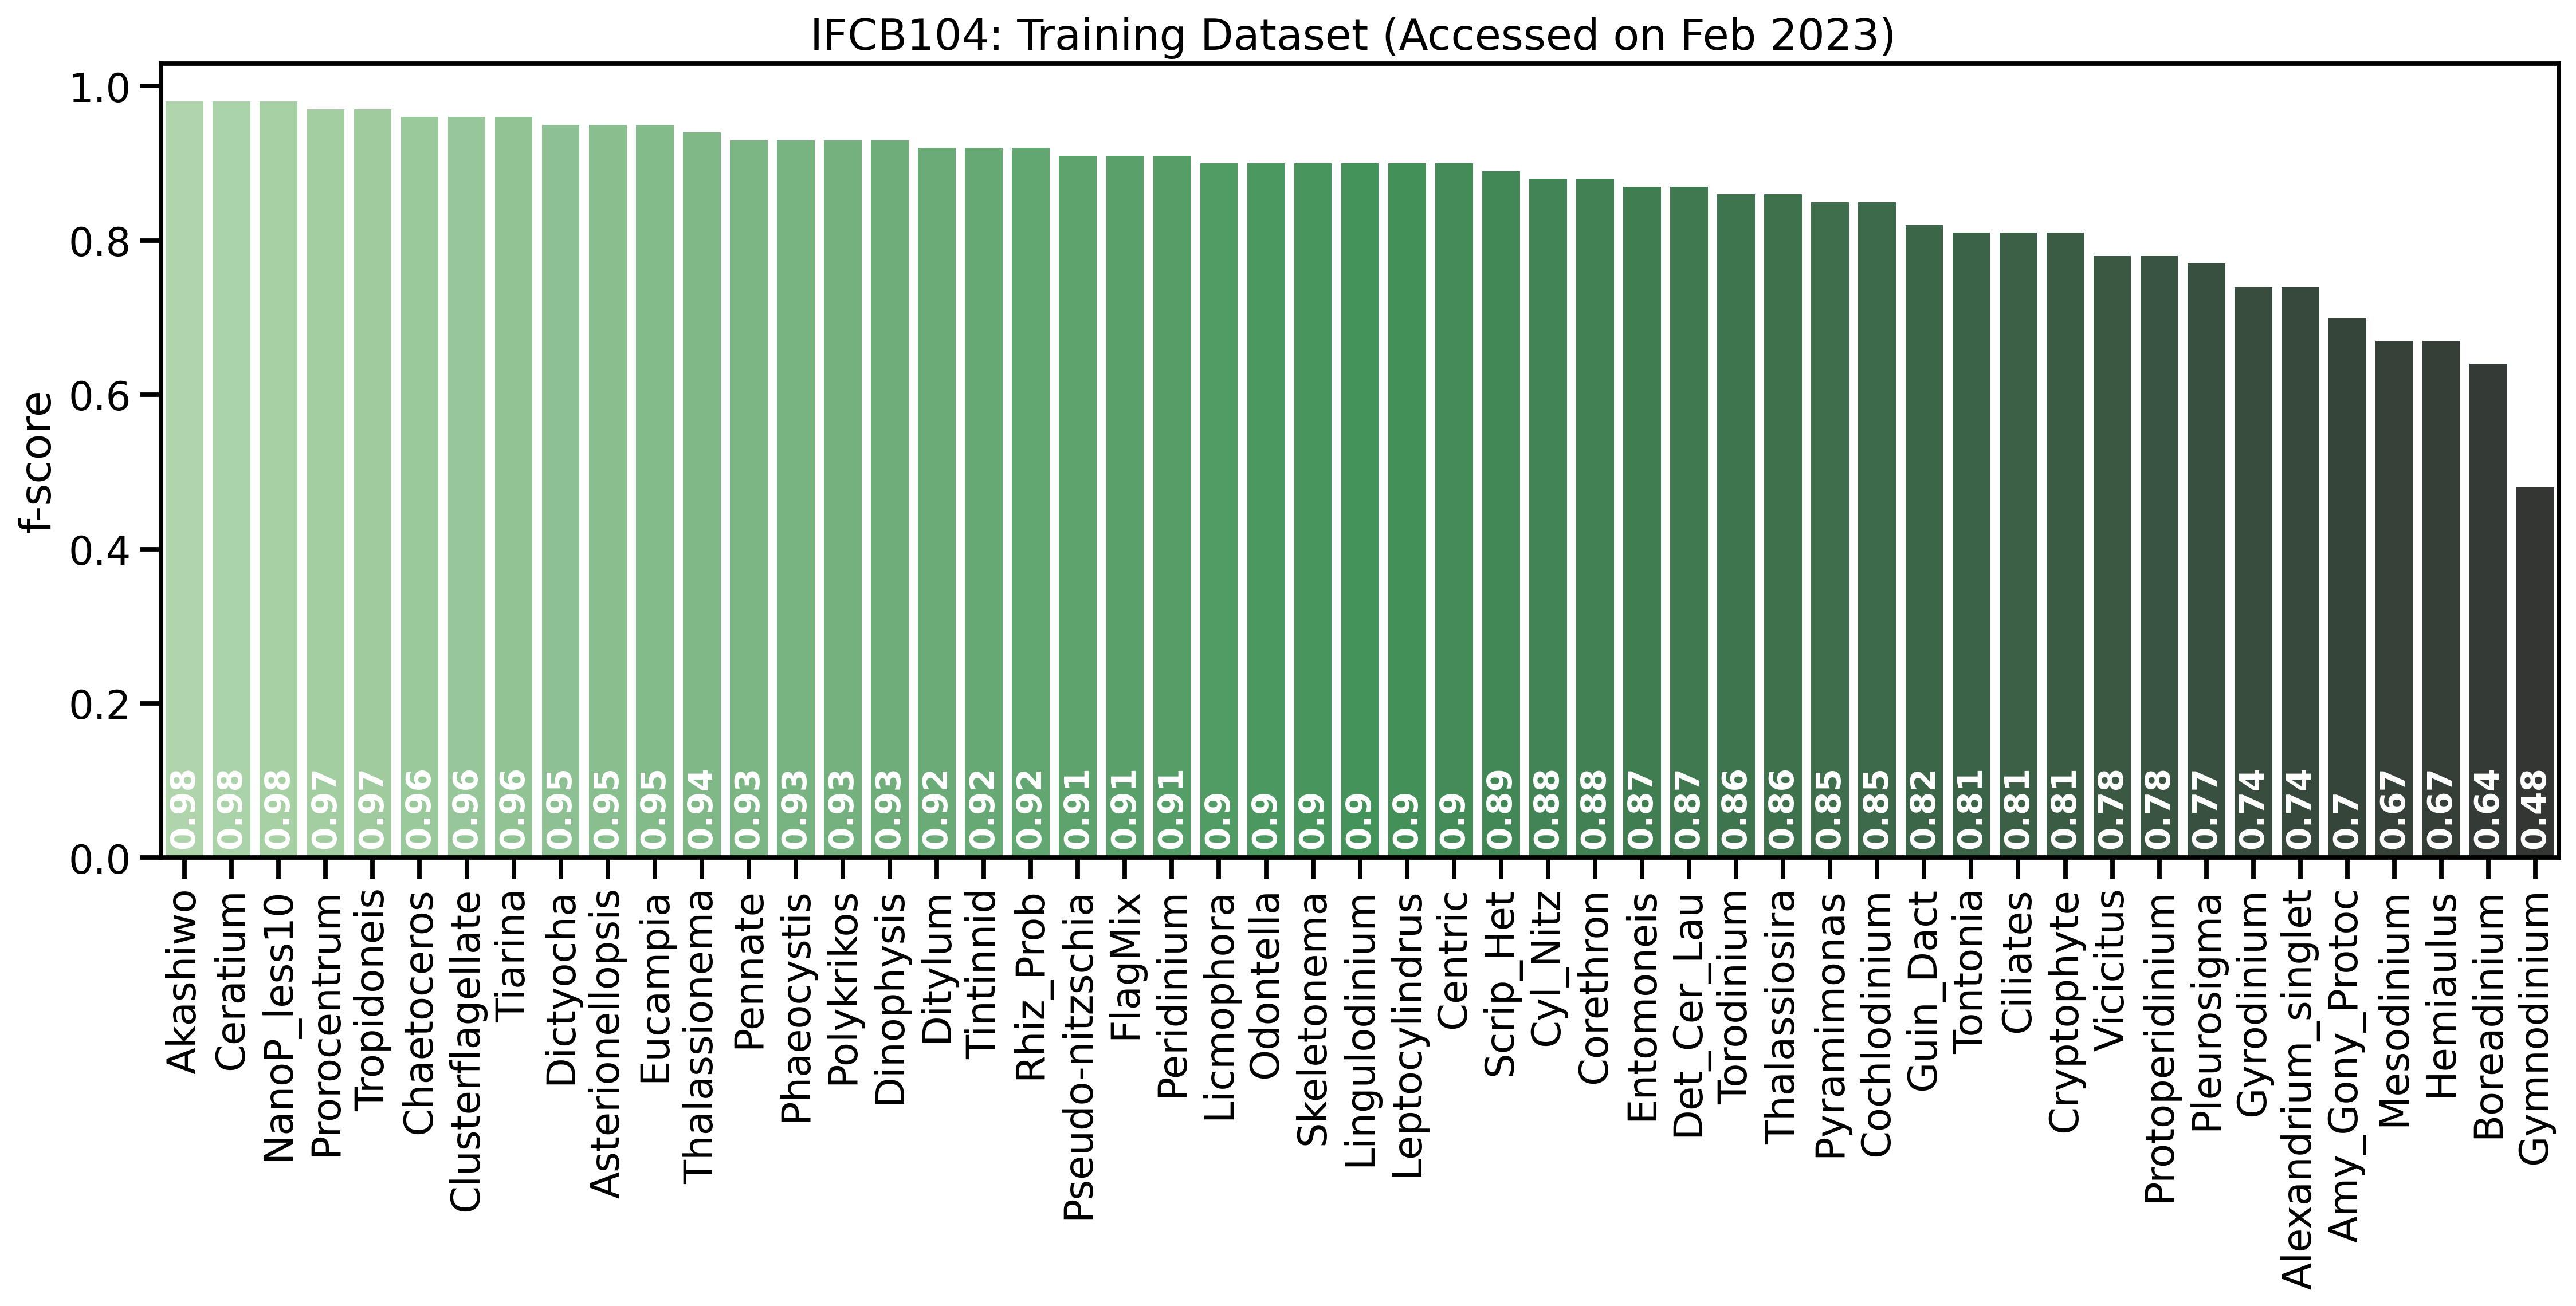
F1 Score is a widely used metric for evaluating classification models that is generally chosen as a balance between precision and recall.
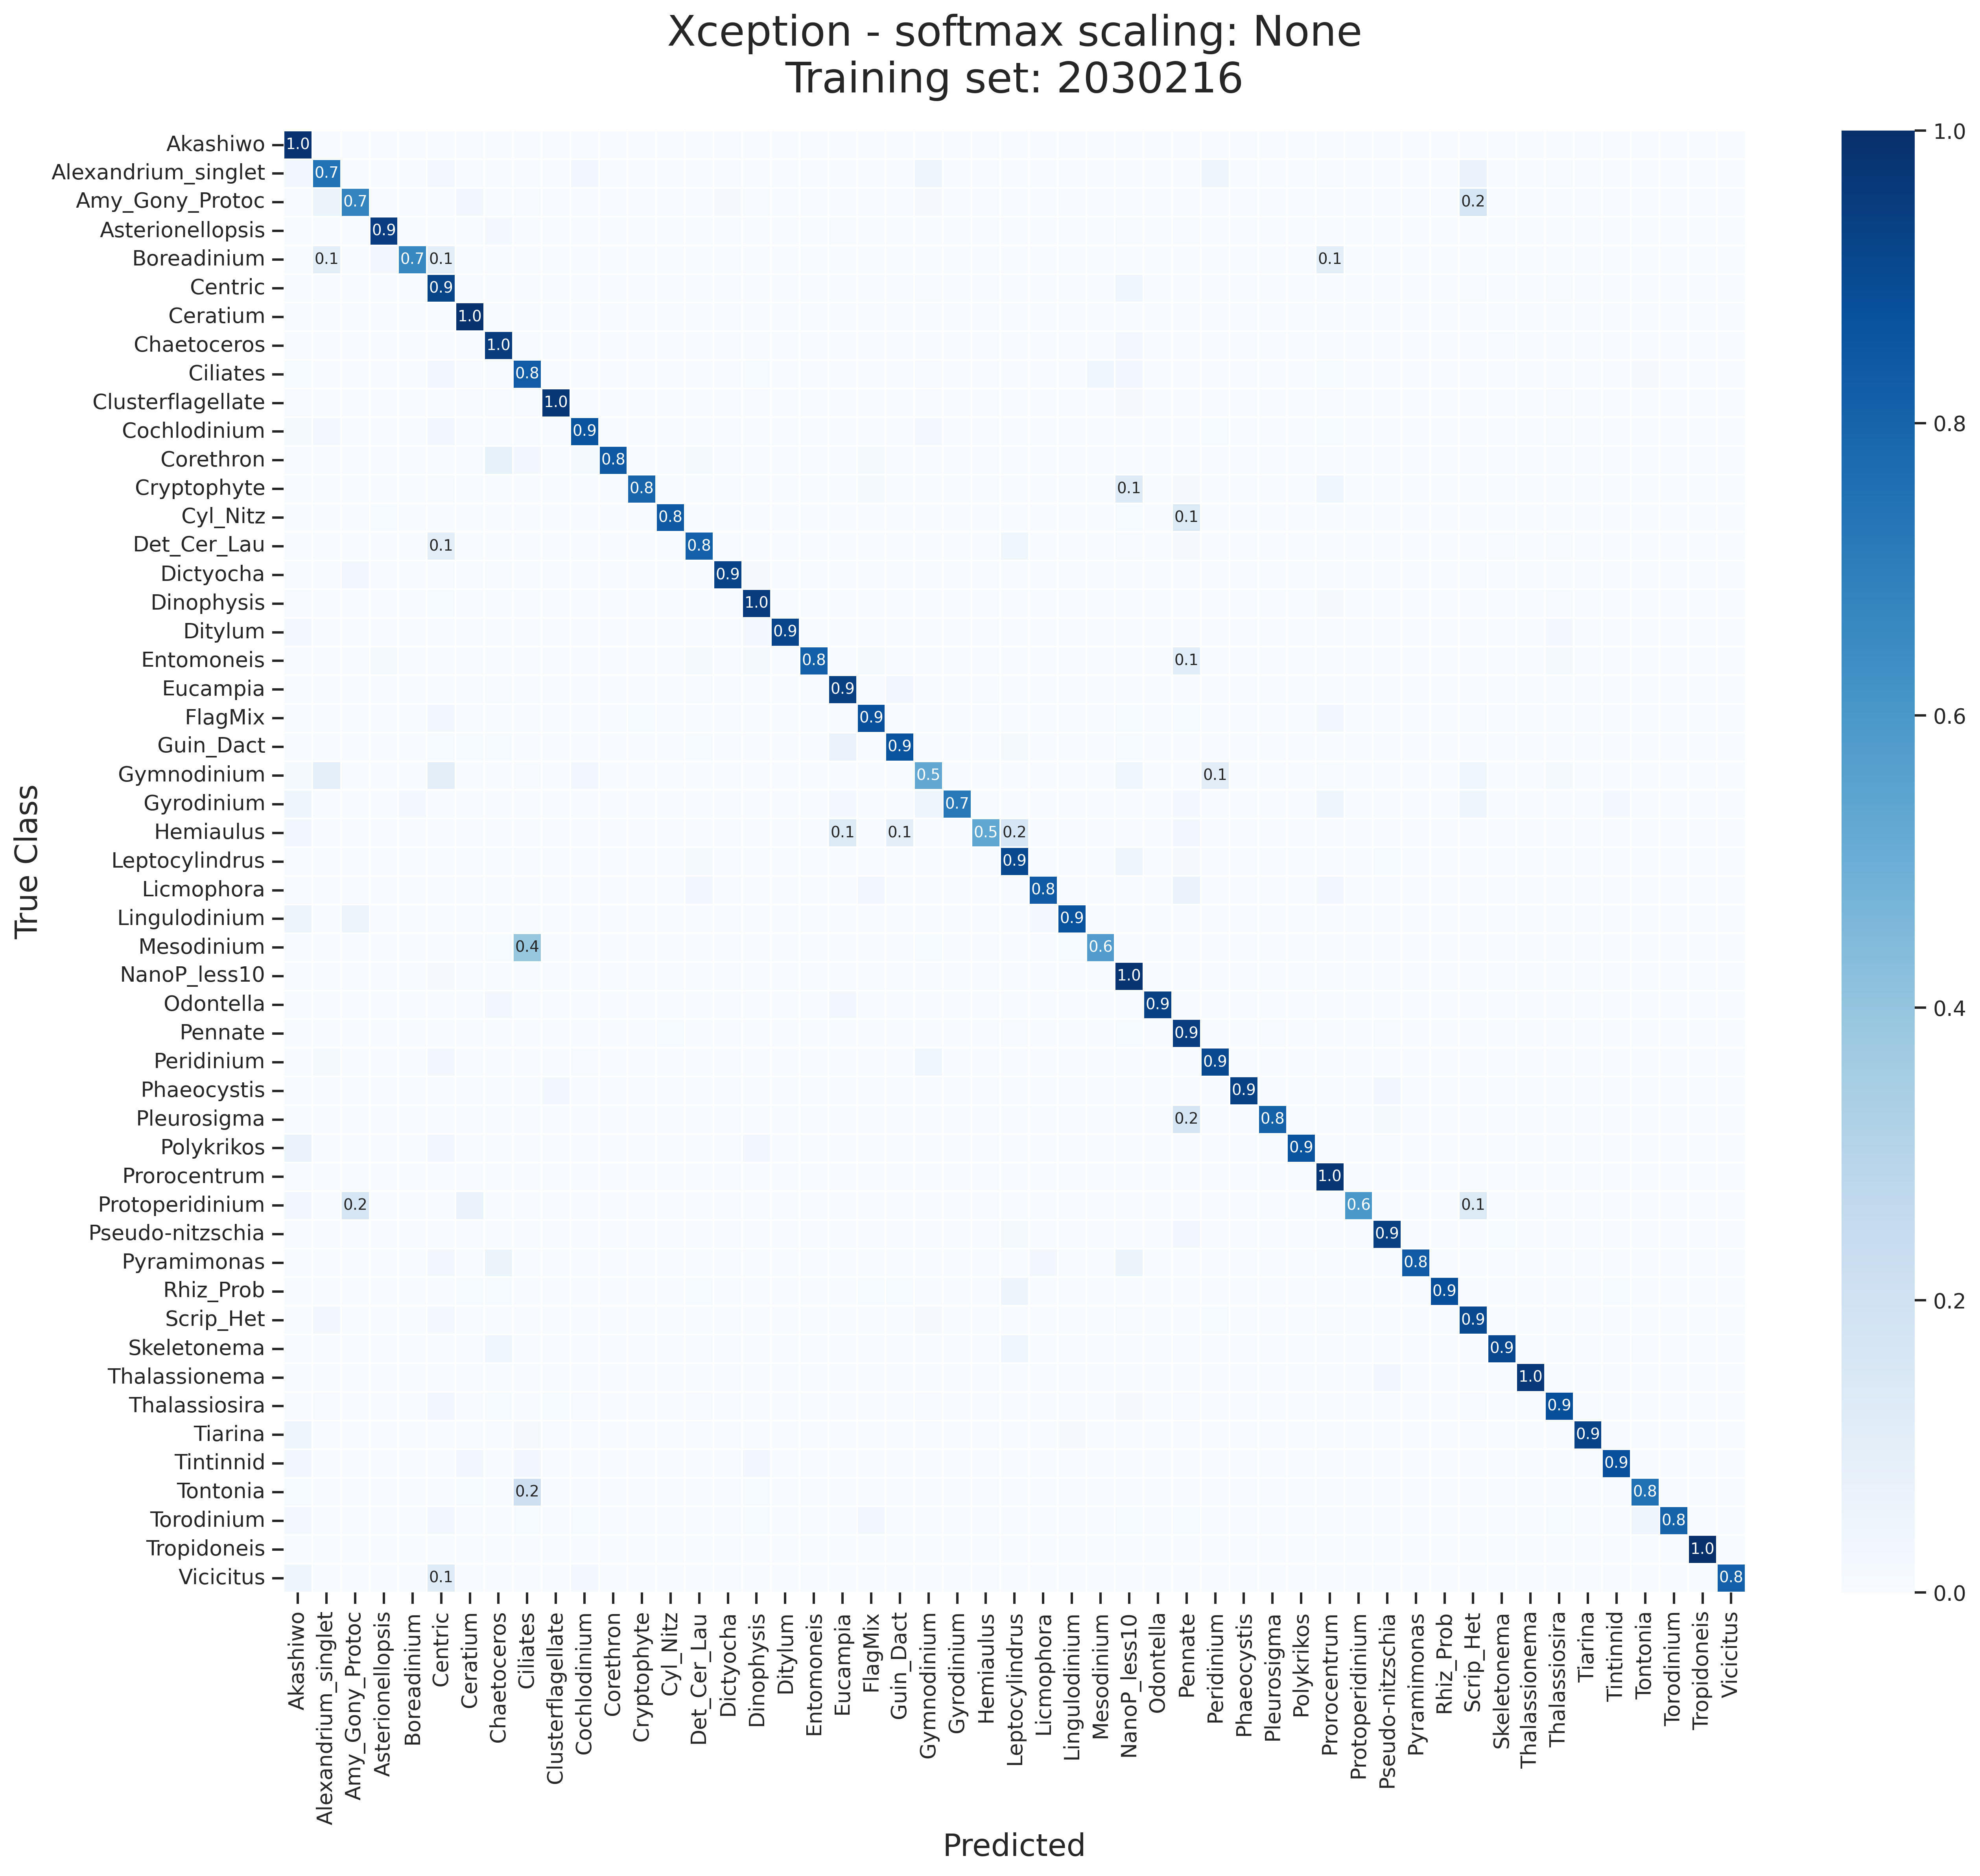
The confusion matrix offers a birds-eye view of model performance. The diagonal cells represent the F1 Score for each class. The off-diagonal cells represent the F1 Score for each class against all other classes. A theoretically perfect model would have a diagonal matrix with all values of 1.0 (dark blue).


Class Specific Threshold
A prediction confidence threshold is chosen for each class to combat the class imbalance that is inherent to the training data. The IFCB samples generally follower a power law distribution, with larger particles being less common than smaller particles. This distribution is reflected in model performance, the model is often most confidence identifying the common, small particles, and less confident identifying the rarer, large particles.
One way to offset incorrectly labling all particles as the most common class is to create class-specific thresholds, meaning that a prediction for each class must exceeds a certain confidence in order to be selected as “correct”. This is a simple way to improve model performance, but it is not a perfect solution. The threshold is chosen by systematically increasing the the threshold value on a set of validation data for each class untill accuracy begins to sharply decrease.
Softmax Scaling Experiments
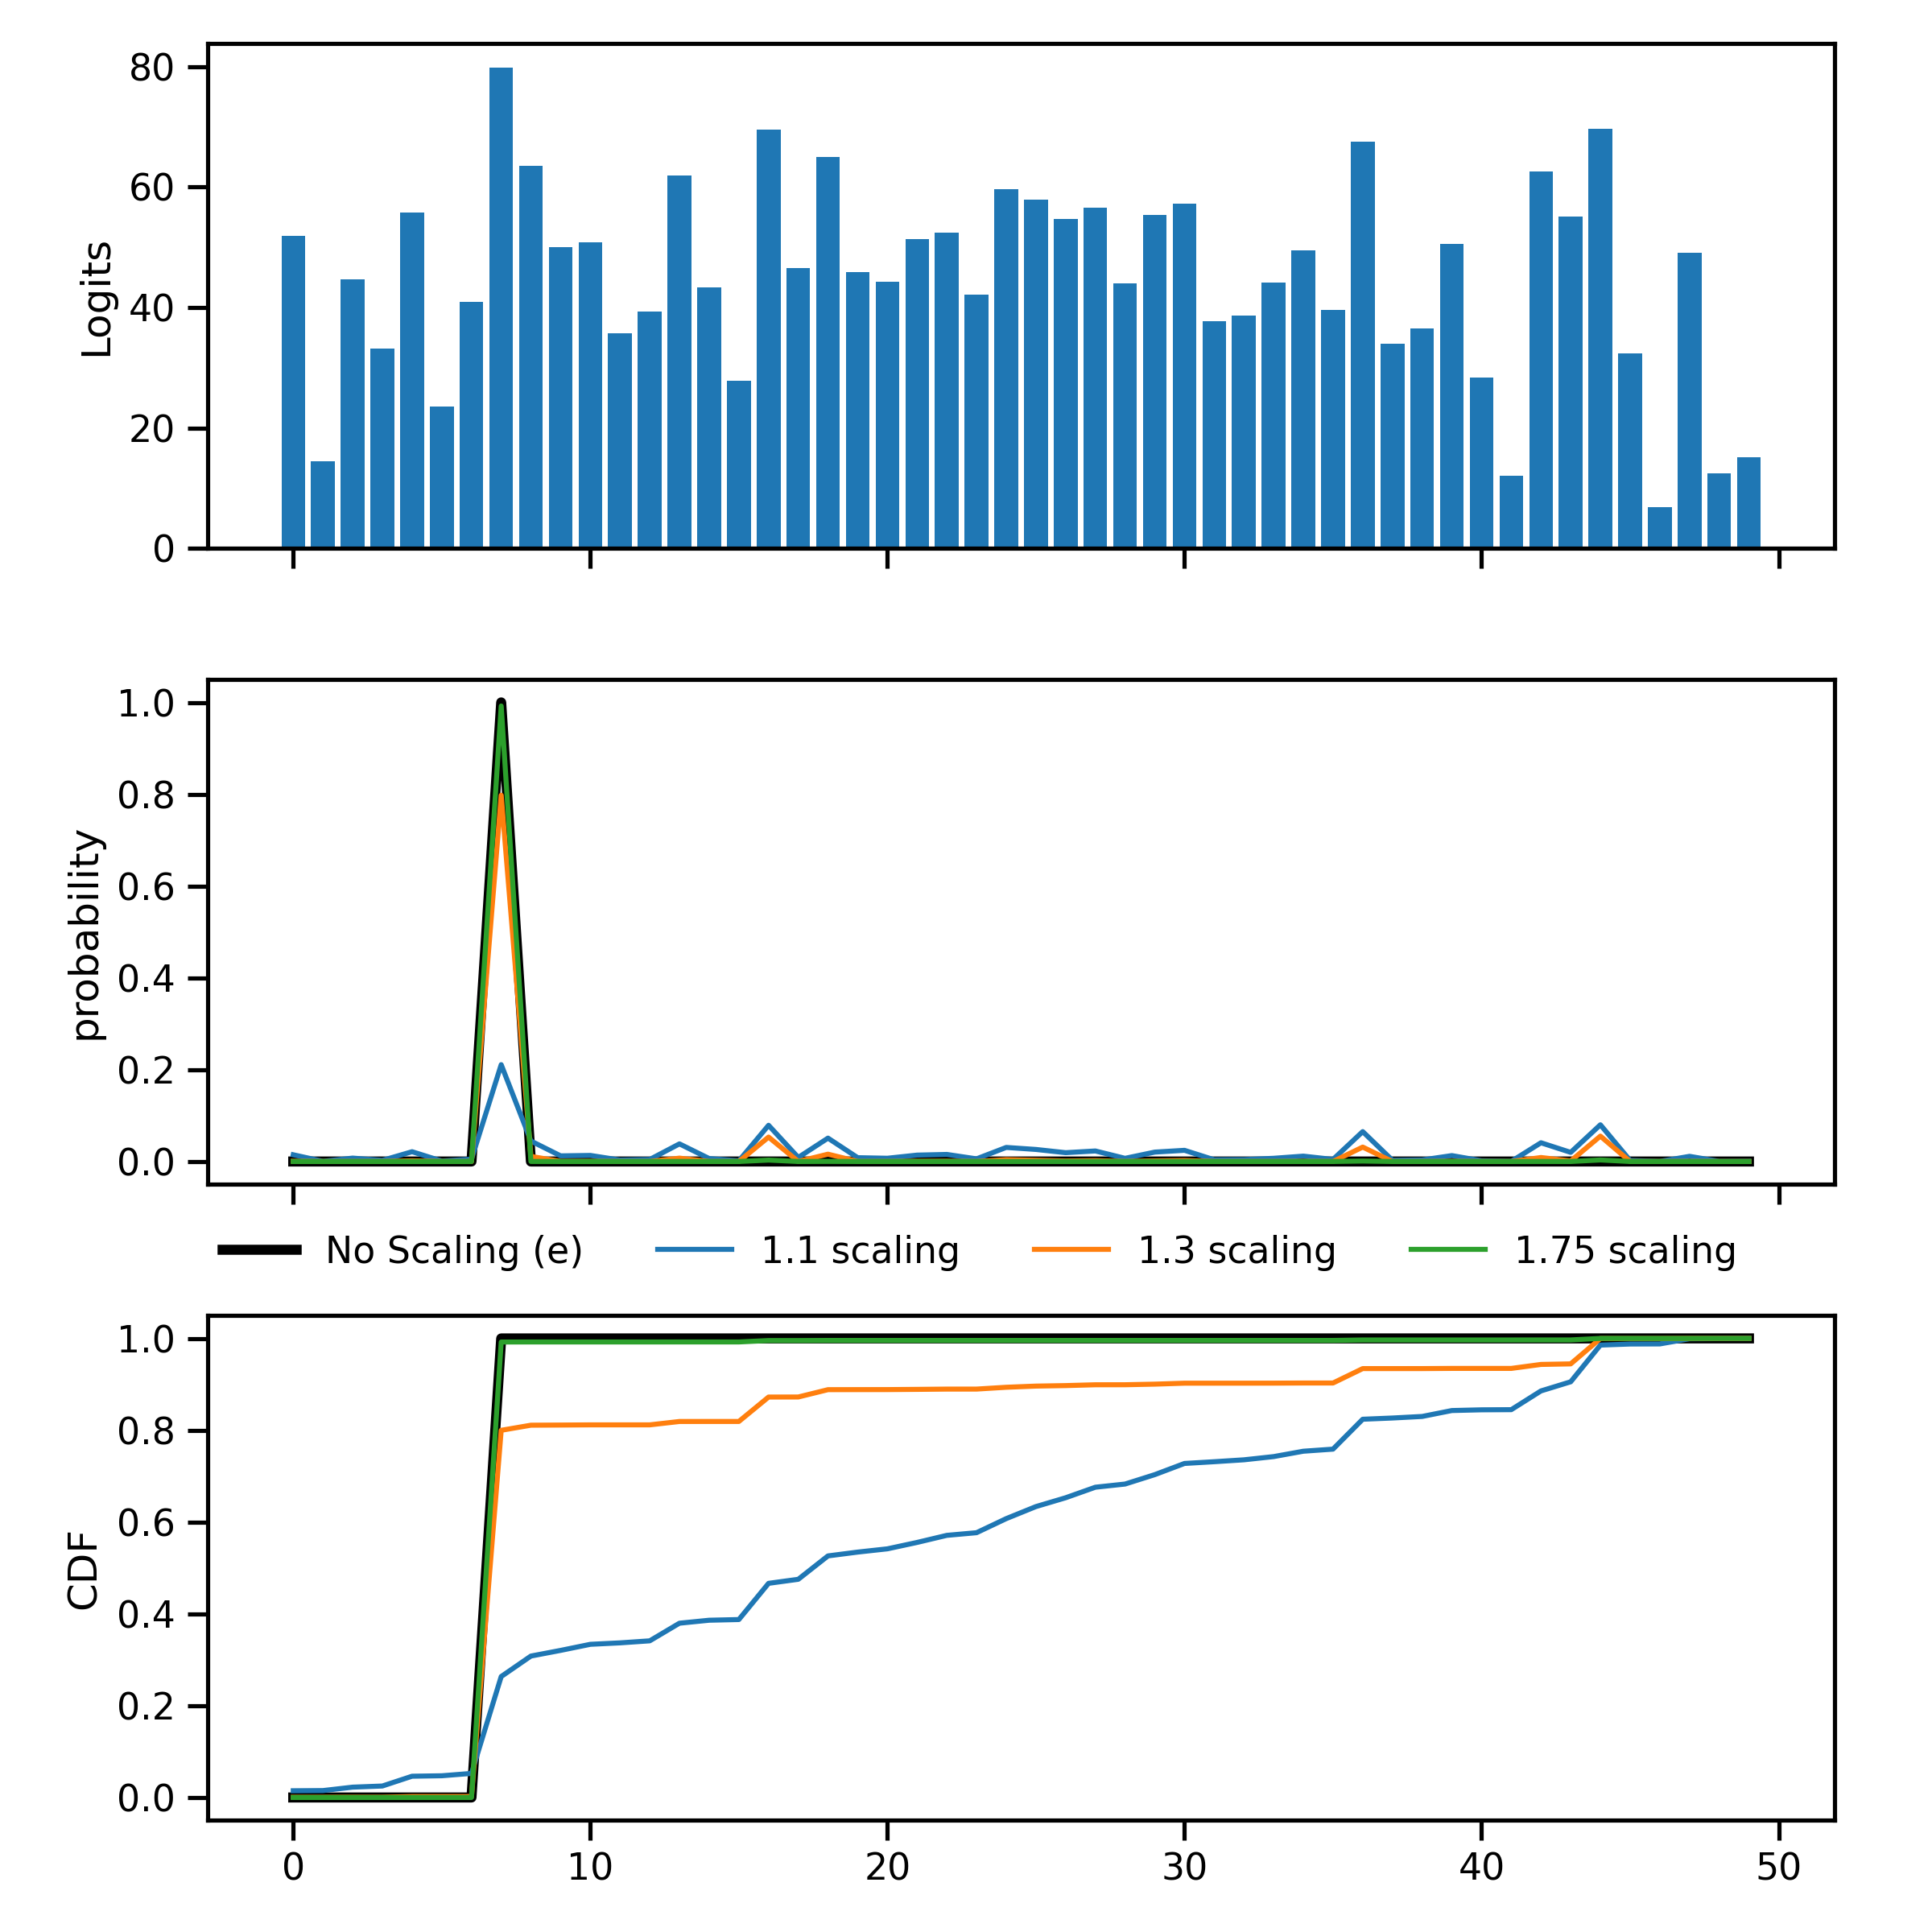
Another option for addressing the out-of-distribution (Out-of-distribution) problem is to use Temperature Cooling. This method scales the softmax output of the model by a temperature parameter. The temperature parameter is chosen by minimizing the negative log-likelihood of the validation data. Below is an example to illustrate the effect of temperature scaling on the softmax output of the model:

In this example, the classification output vector (logits) represents the output of a typical classifcation. A common way to convert logits into a probability across all classes is to use a softmax function, however doing so tends to create overconfidence. By scaklubg tge temperature the probability is “softned” and becomes more distributed across the other classes.
Currently, different temeprature scalings are being evaluated for this model. The results will be posted here when they are available.