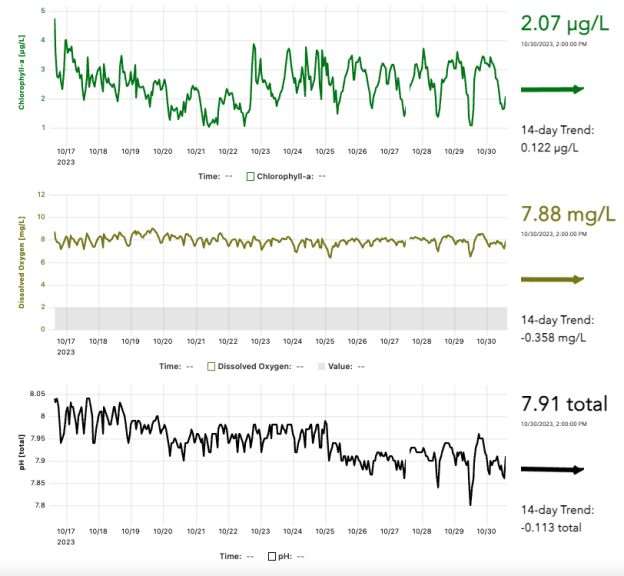
Data are updated every hour. Click and drag to zoom and double-click to reset the zoom.
The arrow represents the trend of a de-tided 14-day regression.
Visit this station in the CalOOS portal: https://data.caloos.org/?ls=RAJgJl-j#metadata/20679/station/data
The arrow represents the trend of a de-tided 14-day regression.
Visit this station in the CalOOS portal: https://data.caloos.org/?ls=RAJgJl-j#metadata/20679/station/data
We acknowledge support from the Morro Bay National Estuary Program and EPA.

