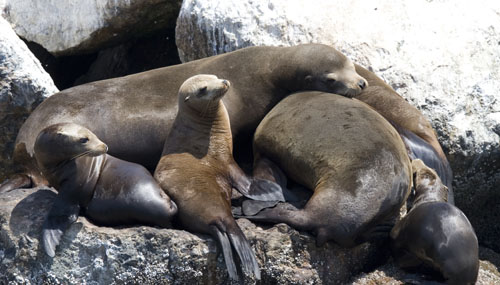
Mission No. 1: Save the Sea Lions!
Monterey is known for having unpredictable algal blooms. In the past, researchers could tell when there was a harmful bloom only when hundreds of sea lion carcasses and dead seabirds washed up onshore. But today, there are easier ways to actually predict a HAB event. Can you save the sea lions from the next HAB event? Try your hand at predicting the next algal bloom!
Below is an important forecasting tool you’ll need to predict when the next event might occur. In fact, this is the same raw data chart scientists use to catalog their weekly phytoplankton samples and determine bloom trends.
At the top of the chart you’ll notice two harmful species. The first is Pseudo-nitzschia, which releases a poison called domoic acid (DA). Pseudo-nitzschia australis and Pseudo-nitzschia multiseries are two types of Pseudo-nitzschia species that cause harmful blooms during certain months. The second is Alexandrium. Alexandrium makes saxitoxin, also known as paralytic shellfish toxin, that can cause death if people eat contaminated clams, mussels, or oysters.
TASK:
Take researchers’ data and create a times-series plot, which is basically a graph that shows the number of individual Pseudo-nitzschia and Alexandrium cell counts over an entire year. Your x-axis should be the date each sample was taken and your y-axis should be the species you’re interested in predicting. Here’s an example of how your graphs might look. (Note: NaN means Not Analyzed)
View the excel spreadsheet and graphs (provided by UCSC Kudela Lab)
QUESTIONS:
- Do Pseudo-nitzschia blooms occur the same time as Alexandrium blooms?
- Can you tell when HABs generally occur?
Mission No. 2: Solve the Mystery of the Full Moon
Here’s your chance to play detective: It’s the night of full moon and evil is afoot. Find out if algal blooms vary according to the moon cycle.
In 2004, there was a mysterious shift in phytoplankton species. Even though diatoms grew faster and were more common, dinoflagellates proved to be better swimmers and found more nutrients at lower depths. The problem today is that the dinoflagellates are now running amuck in Monterey Bay!
TASK:
Use the observational data from the researchers and figure out when there are lots of dinoflagellates –in this case an Alexandrium bloom. Use the StarDate Website to test your mystery-solving skills.
QUESTIONS:
- Does the bloom mirror certain periods of the moon cycle? For instance, after figuring out when an Alexandrium bloom occurred, do you see an increase or decrease when there’s a full moon? How about when there is a new moon?
Mission No. 3: Are Algal Blooms and Ocean Temperatures Related?
You were swimming in the ocean this week and noticed the water was unusually warm, does that mean that an algal bloom might be going on or start soon?
TASK:
See if a bloom might be occurring anywhere in California and whether it could be tied to ocean temperatures nearby; study the weekly composite maps at the link below (the last 8 days worth of satellite data combined).
Sea Surface Temperature (shown on the map on the left side of the page at the link below) is the water temperature at the ocean’s surface. The image represents the most up-to-date information on sea surface temperature. Note: Red means warmest and blue means coldest water temperatures.
Researchers use chlorophyll concentrations or the amount of chlorophyll detected in the water to measure the amount of algae in the ocean (shown on the map on the right side of the page at the link below). High chlorophyll levels may mean that an algal bloom is happening or could happen soon. Note: Red is the highest chlorophyll concentration and blue is the lowest chlorophyll concentration.
QUESTIONS:
- Looking at the two maps together, would you say that warmer or colder sea surface temperatures lead to higher chlorophyll levels in the ocean? Or is the relationship unclear? What reasons can you give to explain your findings?
- Would you say there are other environmental conditions that could play a part in creating an algal bloom (besides temperature)? What might these be and why?
Sea Surface Temperature vs. Chlorophyll maps
Additional Activity Links:
Become a HAB expert page *with answers*
Find lesson plans, activities and explanations at Bigelow’s Laboratory


